


Much has been written about the value of creative placemaking and the absolute necessity to work collectively with the whole community including residents, artists and arts organizations, businesses, elected officials, and, of course, funders. An essential step in realizing your creative placemaking vision is having accurate data that lets you know who and what already exists in your community, and all the better if that data can be visually depicted.
A tool that tracks and compares data year after year informs the decision-making process. It lets you identify healthy growth and illuminates areas needing attention. It can be used for research, planning, program development, exploration, and investment. This kind of information is useful for everyone whether you’re a city planner, artist, civic leader, resident, large or small business, neighborhood association, citywide or neighborhood-based arts and culture organization, non-profit or for profit real estate developer, private foundation, or government funder.
Indicators of Wellbeing
Research conducted by the Social Impact of the Arts Project at the University of Pennsylvania shows that art activities at the neighborhood level can serve as a strong indicator of wellbeing. In Baltimore data representing the social and economic vitality of Baltimore’s neighborhoods has been collected annually, but not comprehensive arts and culture data. It was time to collect and combine arts and culture datasets with the social and economic information to get a true picture of the health of Baltimore neighborhoods and, therefore, the city as a whole.
That’s the thinking that led Baltimore to map its data.
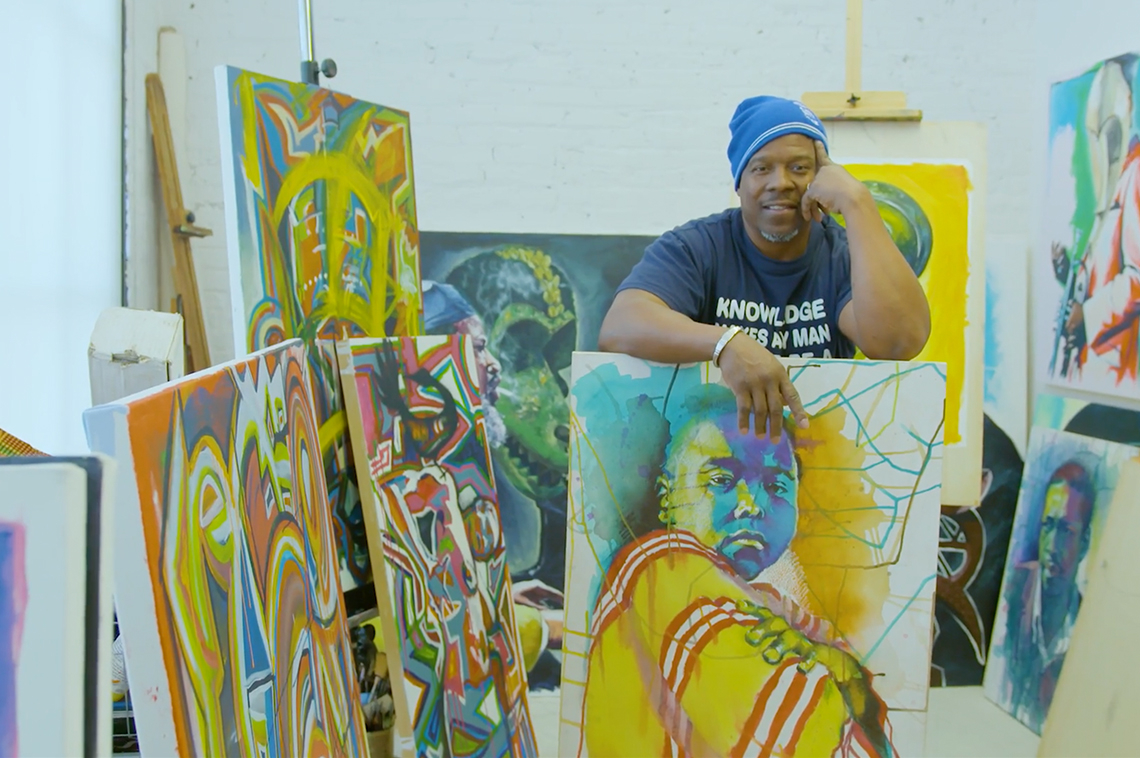
Baltimore has artists. We have arts organizations along with the world class arts-related institutions of higher education. We have neighborhoods that have visible arts activities, but also areas of the city where the details are unknown. And, although we knew we had artists practicing in every discipline, we didn’t really know what resources they needed. Living space? Working space? Performance and exhibition space? Connections to schools for arts education? Funder information?
Equitable distribution of resources
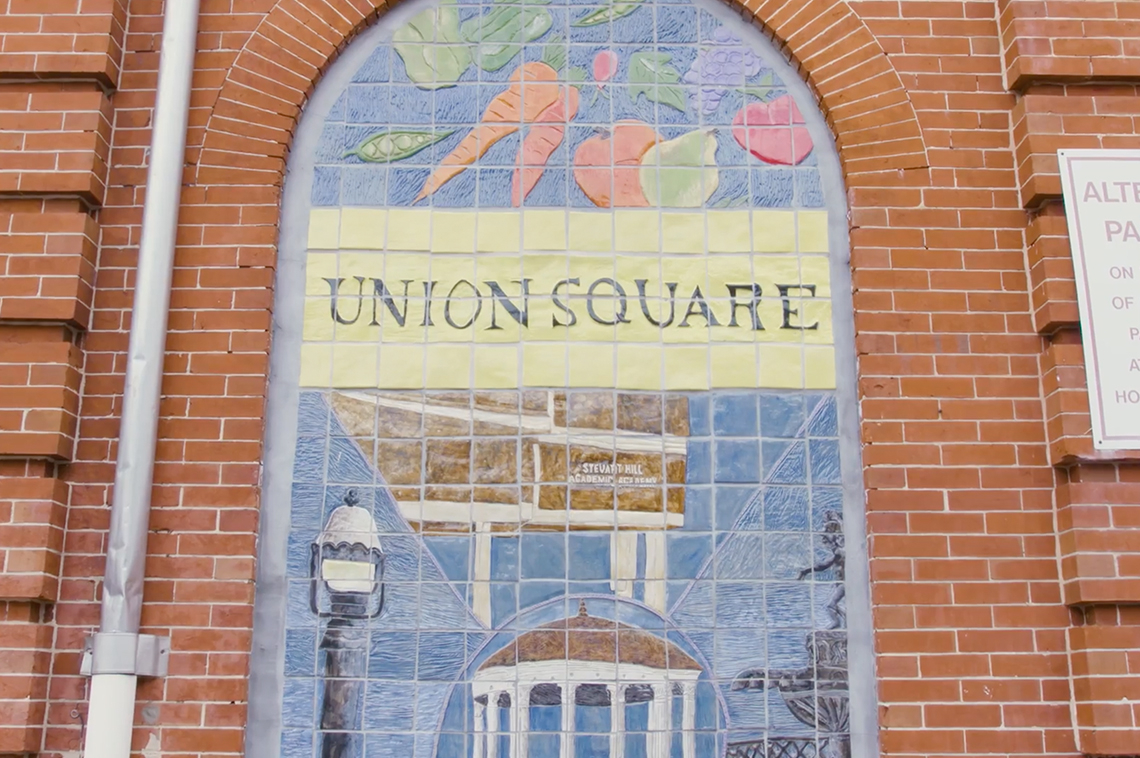
The equitable distribution of resources is always a crucial concern. We really didn’t know what kinds of formal or informal arts activities were or were not taking place within many of Baltimore’s distinct neighborhoods, or whether some neighborhoods were considered “art deserts.”
This led to the creation of a tool for the city: the GEOLOOM co>map. The “co” stands for community, collaboration, and cohesion in Baltimore as well as the co-creation of data by users. It’s an interactive online map that holds over 150 datasets that can be updated on a regular basis. It includes schools that are linked to arts and culture organizations, artists’ studios, and local non arts-related businesses that feature arts activities, but GEOLOOM also has indicators such as neighborhoods with the highest and lowest unemployment levels and areas with the highest and lowest high school graduation rates.
The development of the GEOLOOM co>map was a collective effort, bringing together the foremost aggregator of Baltimore data and the GEOLOOM project manager: the Baltimore Neighborhood Indicators Alliance-Jacob France Institute based at the University of Baltimore, the city’s arts council: Baltimore Office for Promotion and the Arts, the city’s largest arts and culture membership organization: the Greater Baltimore Cultural Alliance, and a local private foundation that has made a significant contribution to Baltimore’s arts ecosystem: the Robert W. Deutsch Foundation.
The group became the project’s Steering Committee and held meetings with key people to determine what kinds of information would be most helpful. Focus groups included residents, civic leaders, the arts community, funders, and businesses. And while GEOLOOM is not a website where the public can find out about events in the city, it includes links to those organizations that provide that kind of information.
You can do this in your neighborhood
Other municipalities or regions, large or small, urban or rural, may benefit from mapping their arts and culture data along with their social and economic indicators to track their community’s vitality. With that in mind, a handbook was created that details the process of the GEOLOOM co>map from concept through to launch. It includes research and development resources, a list of the community stakeholders that were consulted, the project timeline and budget, and the questions and results of a community participation survey conducted to better understand the types of arts and culture activities important to Baltimoreans. There is a great handbook that goes with it- CULTURAL MAPPING: A HANDBOOK FOR DEVELOPING A CREATIVE PLACEMAKING TOOL which outlines the process of creating GEOLOOM and tips on how you can do something simillar. While Baltimore is a city of approximately 600,000 residents, the process can be adapted for a community of any size, city or town, urban or rural. All communities have both formal and informal arts and cultural activities and we believe that mapping them along with other data can assist in the decision-making necessary for making communities vibrant and sustainable.
Launched mid-July of this year, it’s too soon to determine GEOLOOM’s overall success. The responses, however, have been positive and come from every sector of the city. A local youth media organization was commissioned to make promotional videos targeting specific populations and a social media campaign is underway.
The inclusive process used to create GEOLOOM helped to bridge disparate neighborhoods and interests in what has been a very fragmented city. The process has also raised the profile of arts and culture in Baltimore and brought attention to the valuable role they play in fostering livability. Please feel free to contact us for more information at info [at] geoloom.org
Breaking news: GEOLOOM was just selected as Harvard Ash Center's Map of the Month!